
Homelab Project: Integrating pfSense and Suricata with Splunk
In this post, I will be documenting the installation and setup of Splunk within my homelab. I will be installing Splunk on Ubuntu Server 18.04.6. Following the installation, I will set up forwarders on the Windows machines, configure Splunk as a syslog server for pfSense, and configure Splunk to ingest Suricata logs as well.
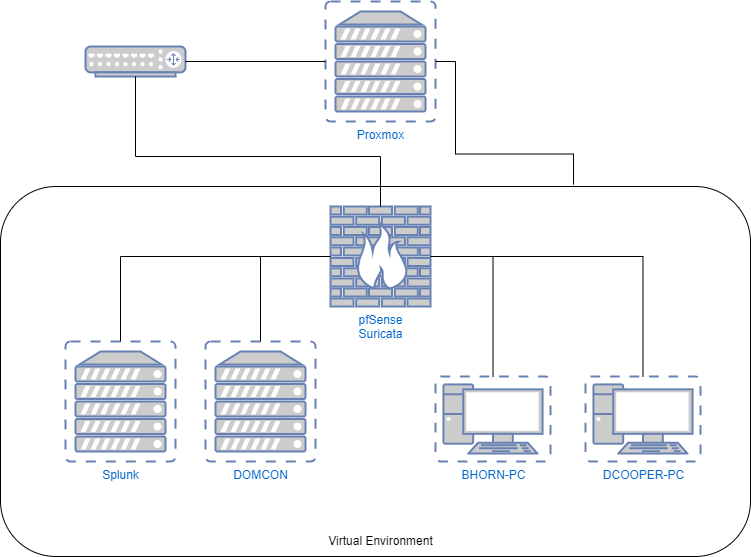
Here is a basic diagram to visualize the additions to my homelab:
Ubuntu VM setup
As stated, I will be running Splunk on Ununtu server. Note: Technically the minimum system requirements for Splunk far exceed what I am capable of providing at this time. This VM would NOT be very useful in a production environment.
Defaults used, unless stated otherwise.
- General:
- VM ID: 102
- Name: Splunk
- OS:
- ISO image: ubuntu-18.04.6-live-server-amd64
- Guest OS:
- Type: Linux
- Version: 6.x - 2.6 Kernel
- System:
- Graphic card: SPICE
- Machine: Default (i440fx)
- BIOS: Default (SeaBIOS)
- SCSI Controller: VirtIO SCSI
- Qemu Agent: disabled
- Add TPM: disabled
- Disks:
- Bus/Device: VirtIO Block
- Storage: local-lvm
- Disk size: 256 GB
- Cache: Default (No cache)
- Discard: disabled
- IO thread: enabled
- CPU:
- Sockets: 1
- Cores: 1
- Type: host
- Memory:
- Memory: 8192 MB
- Network:
- Bridge: vmbr2
- Model: VirtIO (paravirtualized)
- Confirm:
- Start after created: enabled
Installing Ubuntu Server
Press enter to proceed through the installation. At the Network connection page, I set a static IP:
- Subnet: 10.0.0.0/26
- Address: 10.0.0.3
- Gateway: 10.0.0.1
- Name servers: 8.8.8.8,8.8.4.4
- Search domains: none Continue through the installation to the Profile setup:
- Your name: none
- Your server’s name: splunk
- Pick a username: splunkadmin Set a password and continue the installation, making sure that SSH is enabled. Once it completes, go ahead and reboot.
Downloading and Installing Splunk
First, I setup an account with Splunk. Then on the WinAdmin machine, I signed into my Splunk account, and navigated to Products > Free Trials and Downloads. Select Get My Free Trial under Splunk Enterprise.
Select Linux, then download the .tgz installer. After clicking on Download, I was given a wget download option. I went ahead and copied that, then navigated to /tmp on my Ubuntu server and ran the wget command.
Once the Splunk tarball is finished, I navigated to /opt and ran the following command:
$ sudo tar -zxf /tmp/splunk-9.1.2-########-Linux-x86_64.tgz
Once the installer is unpacked, run the following command:
$ /opt/splunk/bin/splunk start --accept-license
Enter an admin name: admin
Enter a password:
Once the process is complete, we can access this Splunk instance at http://10.0.0.3:8000.
Configuring Splunk Receiver
In Splunk, go to Settings > Forwarding and receiving. Then, click on Configure receiving and New Receiving Port. For the new receiver, I am using the default port of 9997.
Setting up Forwarders for Windows
Download and Install Forwarders On Windows Machines
Next, go to the following link and download the forwarder: https://www.splunk.com/en_us/download.html
Run the installer
- Select “An on-premise Splunk Enterprise instance.”
- Create userneame Admin and geneate random password.
- On the Deployment server page:
10.0.0.38089
- On the Indexer page:
10.0.0.39997
After this I repeated this process on the WinUser and DOMCON machines.
Ingesting Windows Logs
In Splunk’s web interface, go to Settings > Add Data. Then select Forward.
- Select Forwarders:
- add all Available hosts, to add both Windows clients and the Domain Controller
- New Server Class Name: windows
- Add Data:
- Local Event Logs: add all
- Input Settings:
- Create a new index: win_event_logs
- Review > Submit
After this go to Search & Reporting, search for index="win_event_logs", and confirm that data from the Event Logs of all three Windows hosts is now being ingested.
Note: For me it took a few minutes for Splunk to begin showing data, so be patient.
Configuring Splunk to Monitor pfSense Logs
Creating Firewall Rule in pfSense
To begin sending logs to a remote server, I will need to create a firewall rule on the WAN interface to allow this traffic.
In pfSense webConfigurator, navigate to Firewall > Rules
- Select the WAN interface.
- Add a new rule at to the top of the rule-list.
- Action: Pass
- Protocol: UDP
- Destination:
- Single host or alias: 10.0.0.3
- Destination Port Range:
- From: other - Custom: 7001 - To: other - Custom:7001
- Description: Allow UDP to Splunk:7001
Splunk Configuration
Create the Index: network
Back to the Splunk web interface, I set up an Index for the pfSense logs:
- Settings > Indexes
- New Index
- Index Name: network
- Save
Data Inputs for Index: network
Now that the index is created, I must set data inputs for it:
- Settings > Data Inputs
- UDP > Add New
- Select Source
- Port: 7001
- Input Settings
- Source type > Select: pfsense
- Method > Custom: pfSense (hostname)
- Index: network
- Review > Submit
At this point, I can perform a search of index="network" and view logs from pfSense, however they are a bit of a mess as Splunk has not been instructed how to parse the data.
Installing Splunk Apps
Fortunately, there is an app within Splunk that will take care of the parsing for us, called “TA-pfSense.” In addition to this app, I will also install “Splunk Common Information Model (CIM).”
To install apps, go to Apps > Find More Apps and search for each.
After both apps are installed, restart Splunk and perform the search index="network" again. Now the logs are properly parsed, and all fields are extracted.
Suricata Setup
Installing Suricata in pfSense
Now I will pivot back to the pfSense webConfigurator, and setup Suricata as an IDS:
Global Settings
- Install ETOpen Emerging Threats
- Install Snort Rules: Free Registered User
- Snort Rules Filename:snort3-community-rules.tar.gz
- Install Snort GPLv2 Community Rules
- Hide Deprecated Rules Categories
- Live Rule Swap on Update
- Save Next, go to Updates and click Force
Go to the Interfaces tab Add New > WAN
- Check the following:
- Enable HTTP Log
- Append HTTP Log
- Log Extended HTTP Info
- Enable TLS Log
- Append TLS Log
- Enable TLS Session Resumption
- Enable TLS Store
- Log Extended TLS Info
- EVE JSON Log
- Enable Logging Magic for Tracked-Files
- MD5
As I am setting this up as an IDS, do not check Block Offenders
Next go to Categories and enable all rules. Then Go back to the interfaces tab and click the green arrow to start Suricata on the WAN.
Adding Firewall Rule
Before moving on from the webConfigurator, create an additional rule to send Suricata logs to Splunk on port 9997
- Add a new rule at to the top of the rule-list.
- Action: Pass
- Protocol: TCP
- Destination:
- Single host or alias: 10.0.0.3
- Destination Port Range:
- From: other - Custom: 9997 - To: other - Custom:9997
- Description: Allow TCP to Splunk:9997
Splunk Setup for Suricata
Installing Splunk App
Just like with pfSense there is an app to parse Suricata logs, as well. This app is called “Splunk TA for Suricata,” and can be added through the Splunk web interface. For the following steps, it will also need to be downloaded from: https://splunkbase.splunk.com/app/2760.
Installing Splunk Forwarder on pfSense
Next I will install a Splunk forwarder on pfSense. Because pfSense is running on FreeBSD and can be a bit limitted, I will be extracting the tarred forwarder on the Splunk server, and then using scp to copy the extracted directory to pfSense.
First I used wget to download the forwarder to the Splunk server’s /tmp directory:
$ wget -O splunkforwarder-9.1.2-############-FreeBSD11-amd64.tgz "https://download.splunk.com/products/universalforwarder/releases/9.1.2/freebsd/splunkforwarder-9.1.2-############-FreeBSD11-amd64.tgz
Next, use tar extract its contents:
$ tar -zxf splunkforwarder-9.1.2-############-FreeBSD11-amd64.tgz
After this we are left with the directory /splunkforwarder and can use scp to copy it over to pfSense:
$ scp -r splunkforwarder/ root@10.0.0.1:/root/
Once the directory is copied over, move it to /opt:
$ mv splunkforwarder/ /opt/
TA-Suricata Setup
With the Splunk forwarder in place, I will copy the TA-Suricata app to pfSense as well. I repeated these steps, downloading the app tarball to the splunk server, extracting its contents, and copying them over to pfSense.
After TA-Suricata is copied to pfSense, move it to the splunkforwarder’s /apps:
$ mv /root/TA-Suricata /opt/splunkforwarder/etc/apps
Next, I created outputs.conf in /opt/splunkforwarder/etc/system/local:
/opt/splunkforwarder/etc/system/local/outputs.conf

[tcpout]
defaultGroup=my_indexers

[tcpout:my_indexers]
server=10.0.0.3:9997
Now, to configure TA-Suricata to monitor the Suricata Eve JSON log I will edit the inputs.conf file located at /opt/splunkforwarder/etc/apps/TA-Suricata/default:
/opt/splunkforwarder/etc/apps/TA-Suricata/default
[monitor:///var/log/suricata/
suricata_vtnet03270/eve.json]
host=pfSense
souretype=suricata
index=ids
Editing inputs.conf
Next, on the Splunk server, I will edit the inputs.conf file at /opt/splunk/etc/apps/TA-Suricata/default to match the inputs.conf file on pfSense. The only difference will be in the top line, which will be:
[monitor://10.0.0.1:/var/log/suricata/suricata_vtnet03270/eve.json]
Creating Index: ids
Next, in the Splunk web interface, create a new index:
- Settings > Indexes
- New Index
- Index Name: ids
- Save
Starting the Forwarder and Restart Splunk
Back on the pfSense command line, I cd into /opt/splunkforwarder/bin and enable the forwarder to start on boot:
$ ./splunk enable boot-start
And then start it:
$ ./splunk start
Finally, on the Splunk server, I restart Splunk:
$ /opt/splunk/bin/splunk restart
Conclussion
After all of this setup I can now view pfSense logs in Splunk by searching index="network", and I can view Suricata alerts by searching index="ids". Further more these indexes have all the interesting fields extracted, which would be of the utmost importance during incident resonse, or investigation.